Global Arms Trade
The True Cost of Global Arms Trade
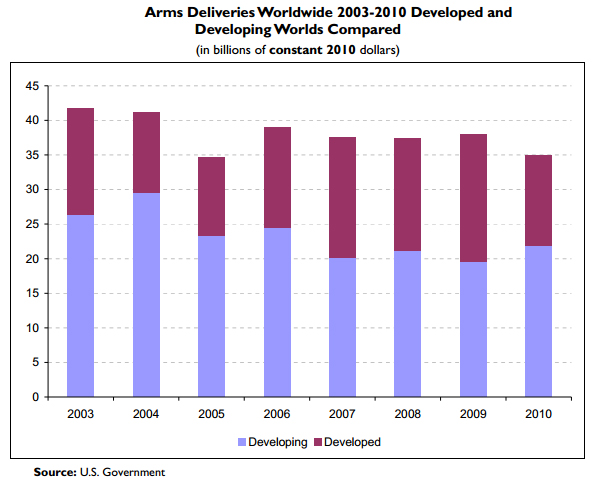
Each year, around $45-60 billion worth of arms sales are agreed. Most of these sales (something like 75%) are to developing countries. The 5 permanent members of the UN Security Council (US, Russia, France, United Kingdom and China), together with Germany and Italy account for around 85% of the arms sold between 2002 and 2009. With the amount of money being sent to developing countries you would think they would put it to good use.
Arms sales (agreements), by Supplier, 2003-2010 (in billions of constant 2010 U.S. dollars)

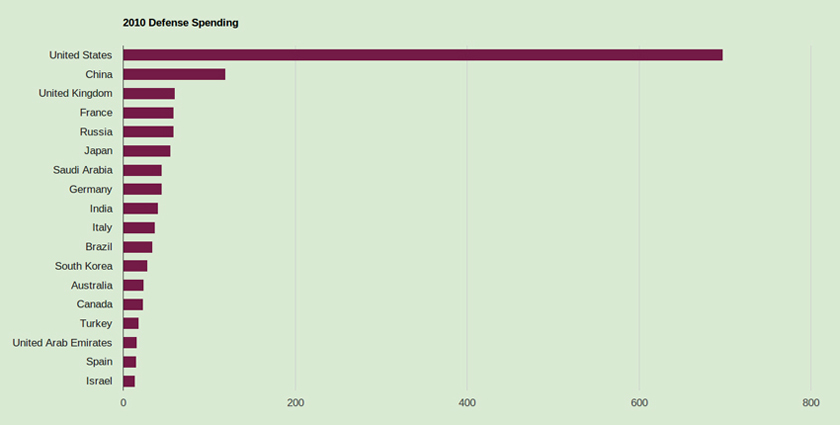
2010 BIG SPENDERS ON DEFENSE: The eighteen nations with the largest military budgets in 2010 are shown in the chart below.

The United States, with a budget of $698 billion, spends more on defense than the next seventeen nations combined. The United States military spending is almost six times that of the next biggest spender, China ($119 billion) and more than eleven times that of Russia ($59 billion. Where does all this cash come from? You guessed it, taxes.
The U.S. accounts for 40% of the world's yearly defense outlays.
Top 30 Countries 2010 Defense Spending by Rank & GDP: Figures are in US $billions at 2010 prices and exchange rates
| Country | Billion | Rank | GDP | GDP Rank | Per Capita |
|---|---|---|---|---|---|
| United States | 698.3 | 1 | 4.7 | 11 | 2,260 |
| China | 119.4 | 2 | 2.2 | 55 | 88 |
| United Kingdom | 59.6 | 3 | 2.7 | 45 | 963 |
| France | 59.3 | 4 | 2.5 | 47 | 915 |
| Russia | 58.7 | 5 | 4.3 | 14 | 419 |
| Japan | 54.5 | 6 | 1.0 | 129 | 429 |
| Saudi Arabia | 45.2 | 7 | 11.2 | 2 | 1,727 |
| Germany | 45.2 | 8 | 1.4 | 99 | 550 |
| India | 41.3 | 9 | 2.8 | 42 | 34 |
| Italy | 37.0 | 10 | 1.8 | 77 | 615 |
| Brazil | 33.5 | 11 | 1.6 | 88 | 172 |
| South Korea | 27.6 | 12 | 2.9 | 39 | 569 |
| South Korea | 27.6 | 12 | 2.9 | 39 | 569 |
| Australia | 24.0 | 13 | 1.9 | 70 | 1,115 |
| Canada | 22.8 | 14 | 1.5 | 91 | 672 |
| Turkey | 17.5 | 15 | 2.7 | 44 | 231 |
| United Arab Emirates | 16.1 | 16 | 7.3 | 4 | 3,410 |
| Spain | 15.4 | 17 | 1.1 | 122 | 339 |
| Israel | 14.0 | 18 | 6.3 | 6 | 1,929 |
| Netherlands | 11.2 | 19 | 1.5 | 93 | 671 |
| Colombia | 10.7 | 20 | 3.7 | 25 | 232 |
| Greece | 9.4 | 21 | 3.2 | 35 | 835 |
| Taiwan | 9.1 | 22 | 2.4 | 49 | 395 |
| Poland | 8.9 | 23 | 1.8 | 78 | 234 |
| Singapore | 8.4 | 24 | 4.3 | 13 | 1,736 |
| Indonesia | 7.2 | 25 | 0.9 | 136 | 31 |
| Chile | 6.9 | 26 | 3.5 | 28 | 404 |
| Norway | 6.7 | 27 | 1.6 | 87 | 1,385 |
| Algeria | 5.7 | 28 | 3.8 | 21 | 160 |
| Pakistan | 5.6 | 29 | 2.8 | 43 | 31 |
| Sweden | 5.6 | 30 | 1.2 | 118 | 607 |
World Countries with Nuclear Weapons Stockpiles
| Country | Continent(s) | First Tests | Operational Warheads | Total Warheads |
|---|---|---|---|---|
| Russia | Asia, Europe | 1949 | 4,650 | 12,000 |
| United States | North America | 1945 | 2,468 | 9.600 |
| France | Europe | 1960 | 300 | 300 |
| China | Asia | 1964 | 180 | 240 |
| United Kingdom | Europe | 1952 | <160 | 225 |
| Israel | Asia | *1979 | Unknown | 80 |
| Pakistan | Asia | 1988 | Unknown | 70-90 |
| India | Asia | 1974 | Unknown | 60-80 |
| North Korea | Asia | *2006 | Unknown | <10 |
| * unverified | ||||
| World | 7,700 | 22,600 |

More Like This


Data Sources
- Richard F. Grimmett, CRS Report for Congress; Conventional Arms Transfers to Developing Nations
- http://www.globalissues.org/issue/73/arms-trade-a-major-cause-of-suffering
- http://www.rickety.us/2011/06/2010-defense-spending-by-country
- http://www.blatantworld.com/feature/the_world/nuclear_weapons_stockpiles.html


